
Often the easiest techniques are the most effective. The most common Technical Analysis tools are trend lines. They are effective for many traders especially when combined with other tools, such as indicators.
During the recent BTCUSDT uptrend, I drew a trend line that helps me predict where the future support levels can be established. To do it, I pick the Trend Line menu from the PrimeBit drawing menu (1) and connect the tails of the candlesticks that mark local retracements (2). As you can see, after a short period of a price decrease, buyers activated their orders just right at the trend line (3).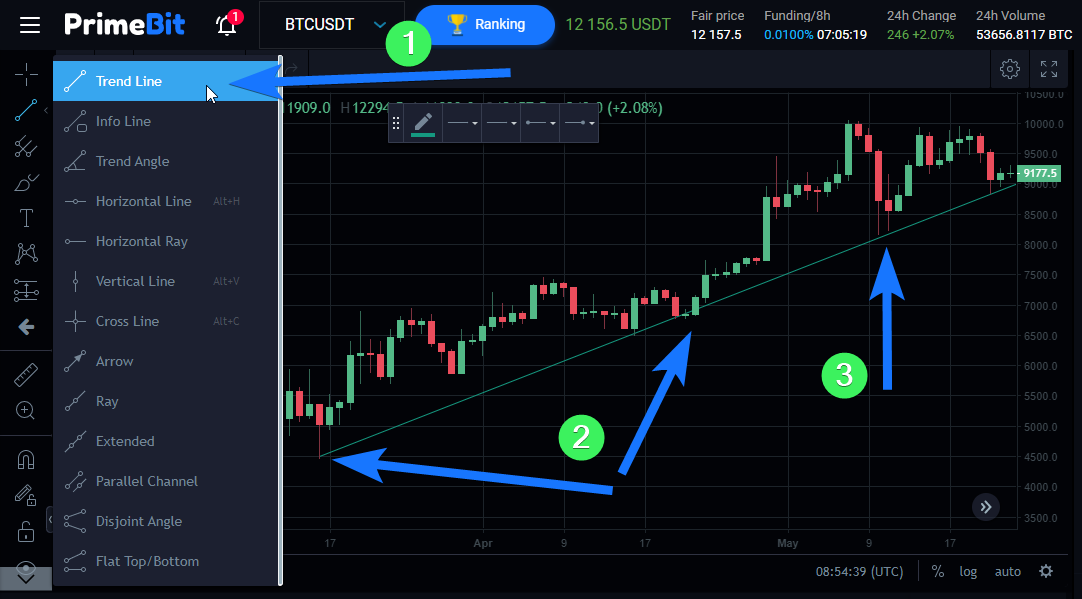
To increase the chance of spotting reliable support and resistance zones, you can also employ one of the indicators. Again, it’s probably best to start with the most simple one, which is moving average.
Open the “Indicators” menu (1). They are listed alphabetically. Scroll down to “Moving Average” (2).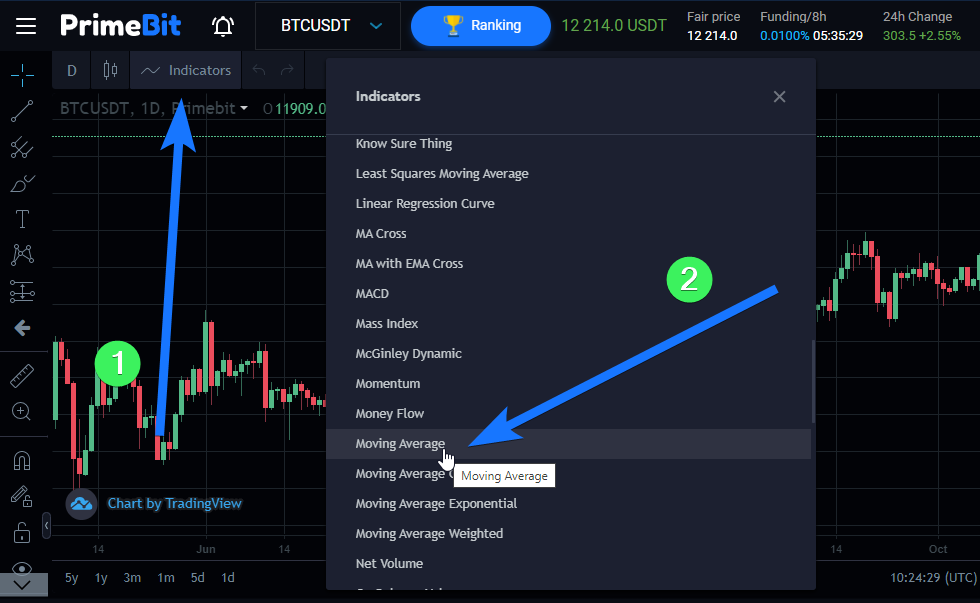
You can compare moving averages for different periods of time and discover new trends. Start analyzing moving averages in longer time frames, and then dig into shorter periods to discover trends that work the best for your trading style.
In the chart below the 1-hour BTCUSDT chart shows an upward trend with a moving average indicating price supports, potential buying zones.
Now, here’s a trick for you. You need to adjust your moving average, so it’s useful for your particular analysis. Click the cogwheel (“⚙”) to open moving average settings (1). Use the arrows to adjust the “Length”, which is the number of candles used to draw the average (2).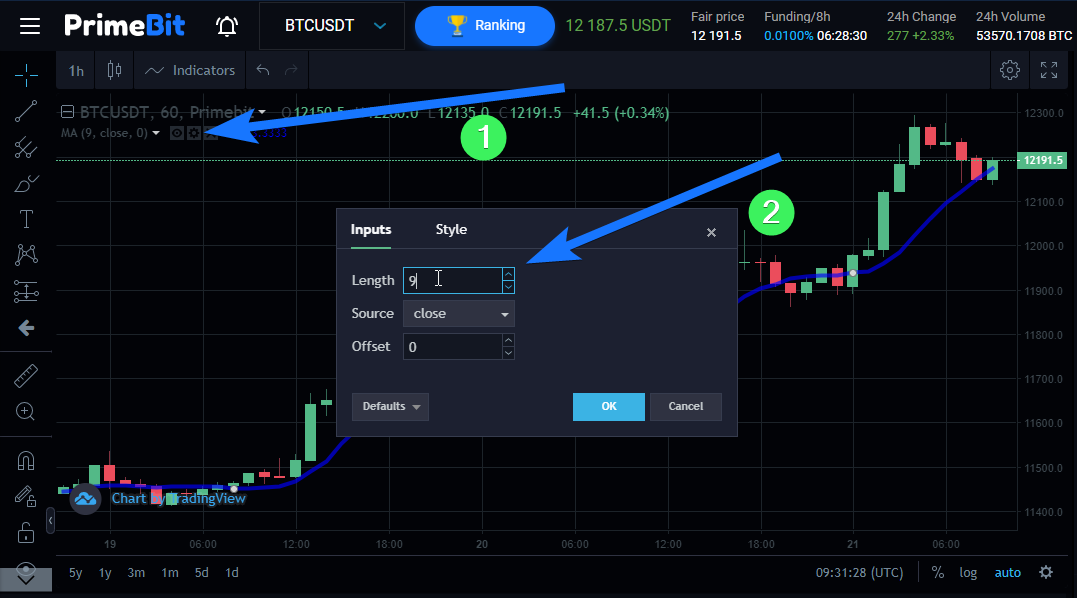
In the example below, I spotted an uptrend on a BTCUSDT 60-minutes chart. I set the length to 18, so the moving average line touches the candles during the local retracements. Now I can assume that there’s a chance for the pattern to repeat in the future, and the price will “bounce” off the line.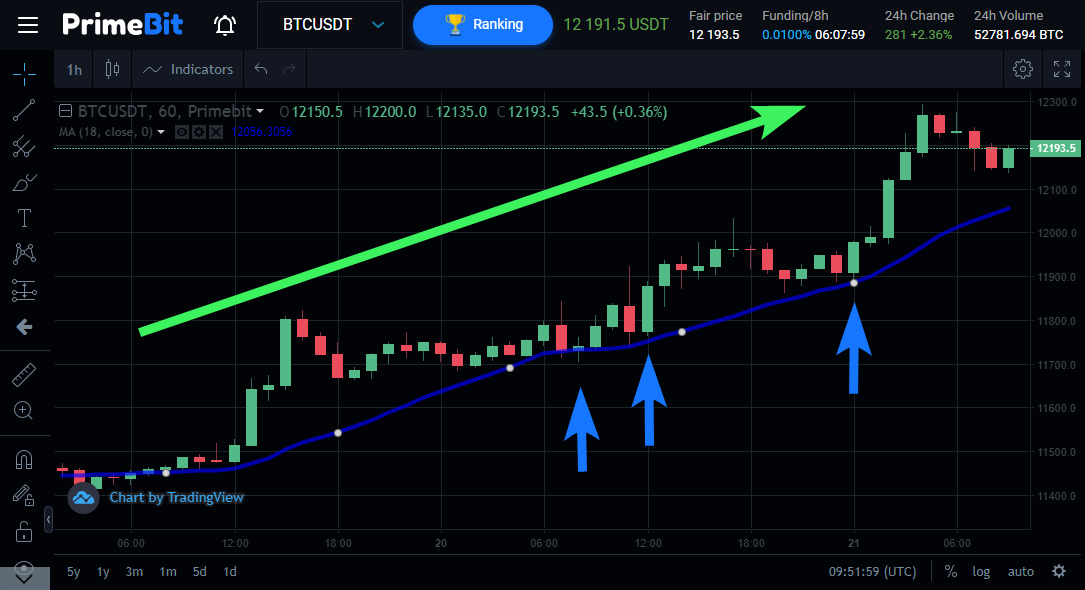
On the other hand, when I look at the 5-minutes BTCUSDT chart, the moving average suggests we are experiencing a local downward trend. I can use the same technique, adjust my moving average, and try to predict the future resistance levels.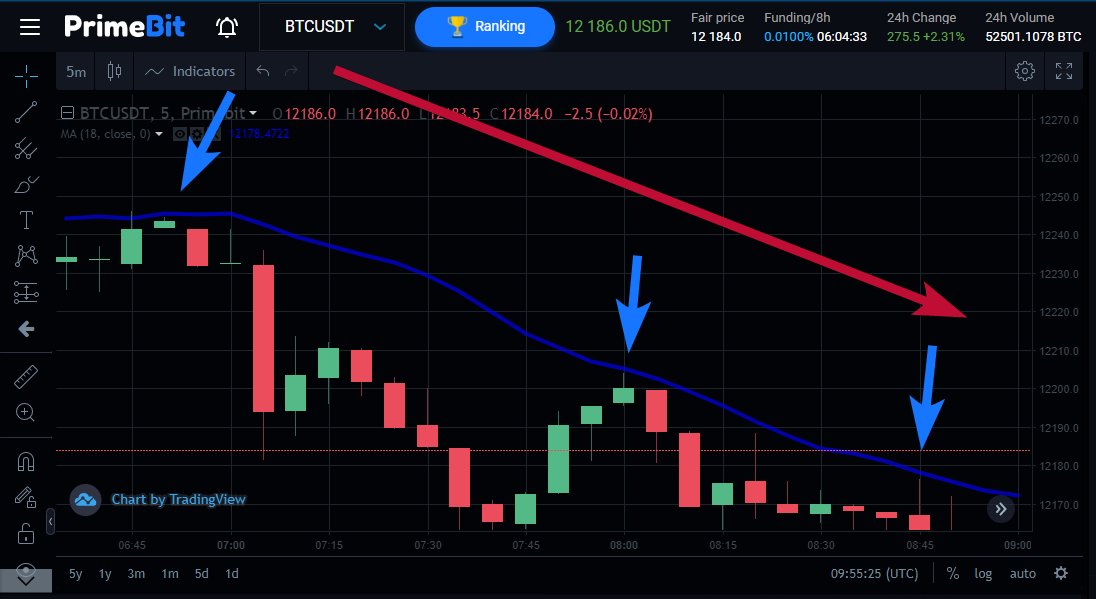
Remember that traders have a set of their own technical analysis tools and indicators that fit best to the timeframe, market, and trading style. Give it a go and find out your own set. I hope this guide will help you discover your trading way.
Give it a try on your PrimeBit Contest Account. We give away $5,000 in tether to the best traders. Each week there’s a chance for you to win. Go to PrimeBit now, make your first trade and check out your position in the Contest ranking.
