
Reading price charts is not as difficult as it may seem. The most popular method to read past price behavior is the Japanese candlesticks chart. It originated in Japan over 100 years before the West developed the bar and point-and-figure charts. With candlesticks, you can get an insight into the most important information about the price history – open, close, high, and low prices throughout the period of time.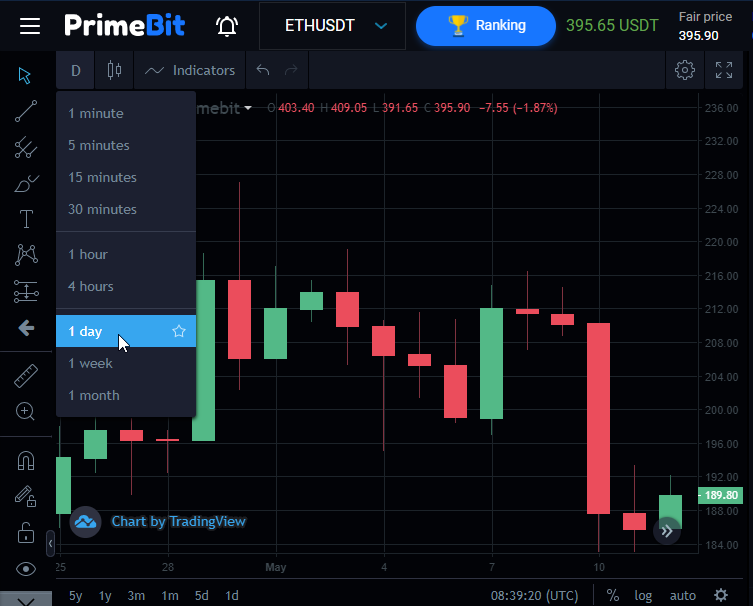
Japanese candlesticks are made of vertical rectangles (called body) with lines at the bottom and top (called tails or shadows). The rectangle width is always the same – it represents the chosen timeframe, such as the 1 day period (candle) on the above BTCUSDT chart.
Green candles indicate that the closing price was higher than the opening price, while red candles say that the closing price was lower than the opening price. A few red candles in a row represent a downward price movement, while green candles reflect price uptrend.
How can I make decisions using candlestick price charts?
The green 1-day candle below says that on May 7 the ETHUSDT price opened at 199 (1), and closed at 212 (2).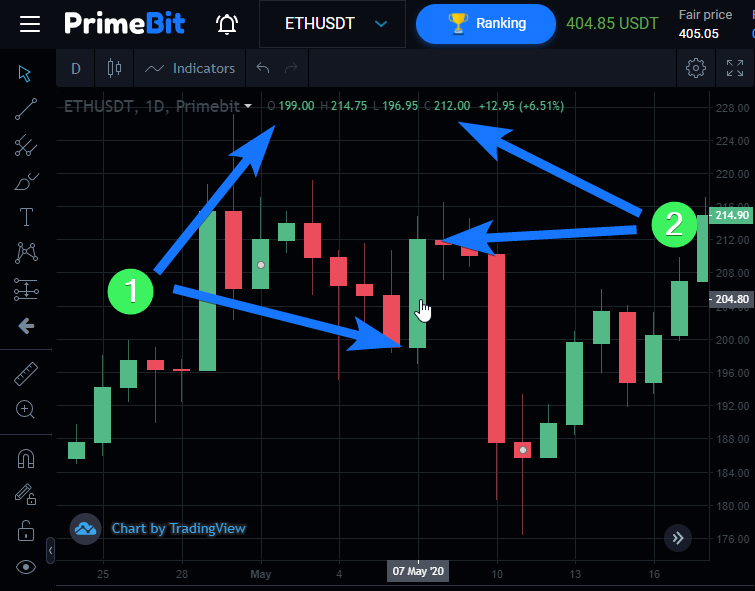
The shadows represent the lowest and highest price within a day. If the green candle has no shadows, it means the highest price was no higher than the closing price and the lowest price was no lower than the opening price.
The red candlestick below says that on May 3 ETHUSDT opened at 213.90 and closed at 209.85. Candle shadows indicate that during the day the symbol was traded as high as 219.10 (1) and as low as 205.25 (2).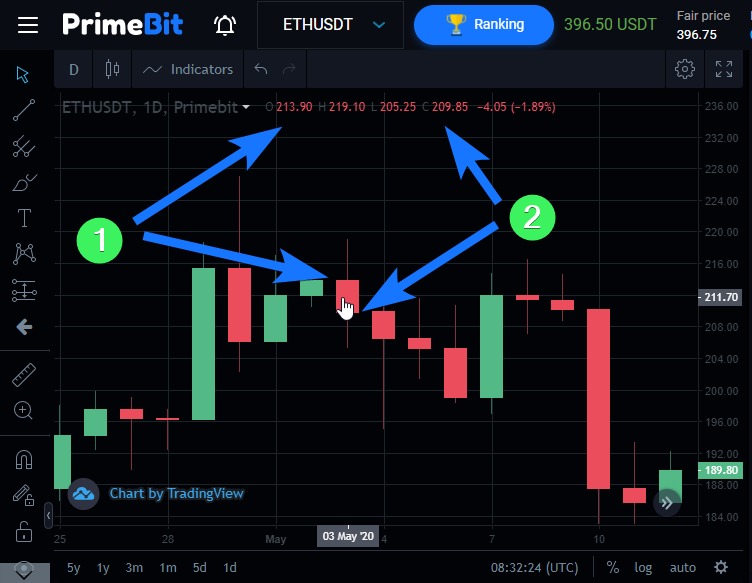
The great thing about candlestick charts is that they have been utilized by traders for centuries on different markets, and recognized as an efficient identification tool for market turning points. An experienced eye can recognize reversal patterns and take advantage of a new price trend direction.
Depending on the trend you can have both bearish and bullish reversal signals. The bearish patterns are a call for a short order (sell) and bullish signs suggest you should go long by placing a buy order.
Basic candlestick reversal patterns
Bullish engulfing
During a downtrend after a red candlestick (1) comes a green candlestick that fully covers the previous red candlestick (2). This signal suggests a possible trend change.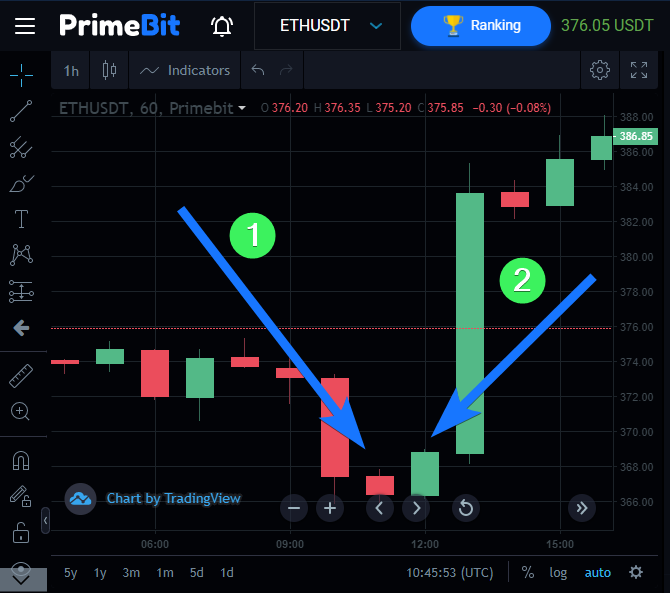
The signal above was very strong since the green (2) candlestick was twice as big as the red one (1). Indeed a strong ethereum recovery took place at that time.
Bearish engulfing
This signal is a reverse of the bullish engulfing. The pattern often comes just before an uptrend turns into a downtrend. 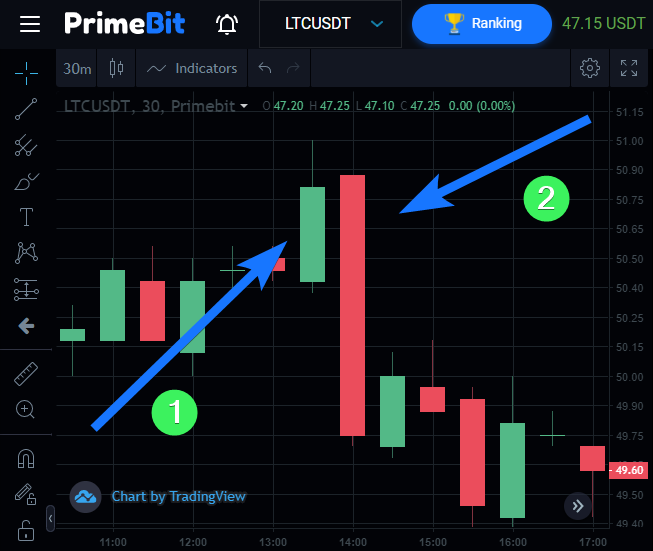
At the LTCUSDT chart above, the price rallied all the way to $51 before a reversal pattern occurred. A green candle (1) was followed by a much more profound red candle (2) that fully covered the green one. If you were trading at that time, you should have considered opening sell orders or reducing your buy positions after seeing this warning sign of price reversal.
A hammer
This pattern is very easy to recognize. You just look at a green candle that looks like a hammer – has a short body and long lower shadow – four to five times as long as the body. Let me find one for you… Here you go: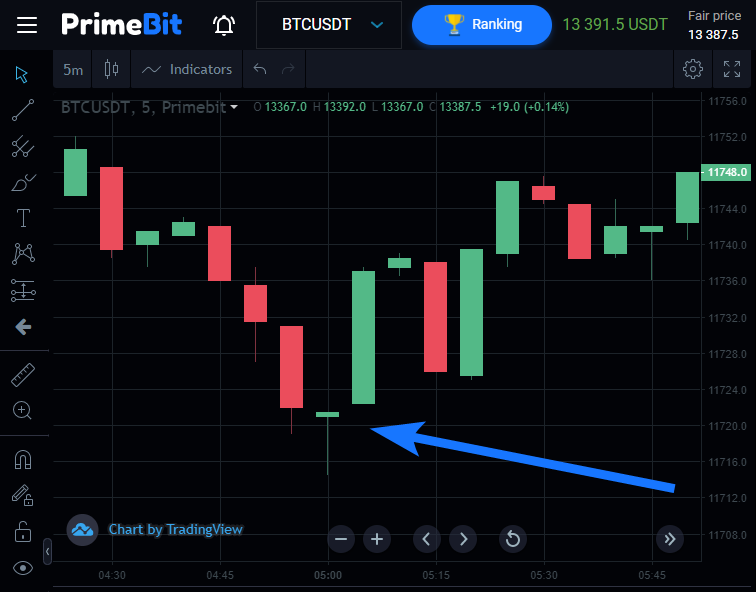
Morning Doji Star
The pattern consists of three candles. First, an ordinary red candle, then the Morning Doji Star – a red candlestick with a very short body and long shadows – which is then followed by a green candlestick.
In this 5m LTCUSDT chart, you can see a downtrend with several retracements followed by a morning star that created a signal of the upcoming market reversal.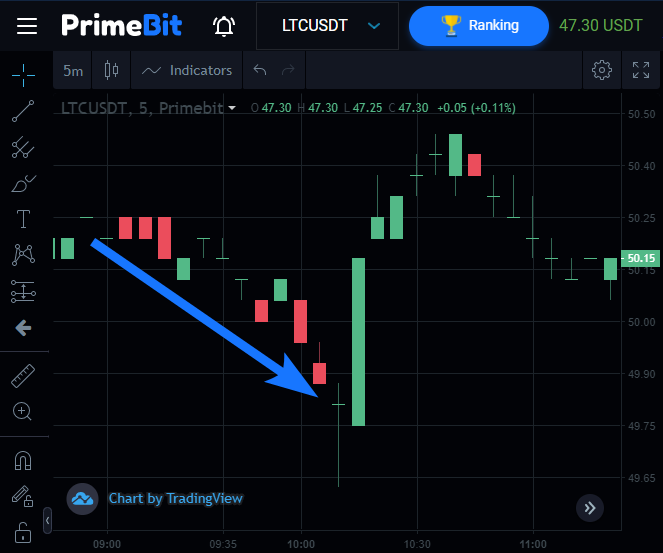
The signal is stronger when the green candle following the morning star is larger than the red one or closes above it. We have both conditions met in the example above what made this pattern a strong buying setup. As you can see, it worked out as anticipated in the next minutes.
Dark cloud cover
This is a bearish two-candle pattern. Take a look at the 1-day ETHUSDT chart below. A green candlestick (1) is followed by a red one (2) that opens higher but closes beneath the middle of the green candle. You may wait for the next candle to come for confirmation – if the next candle shows a downtrend – you may consider taking a short position.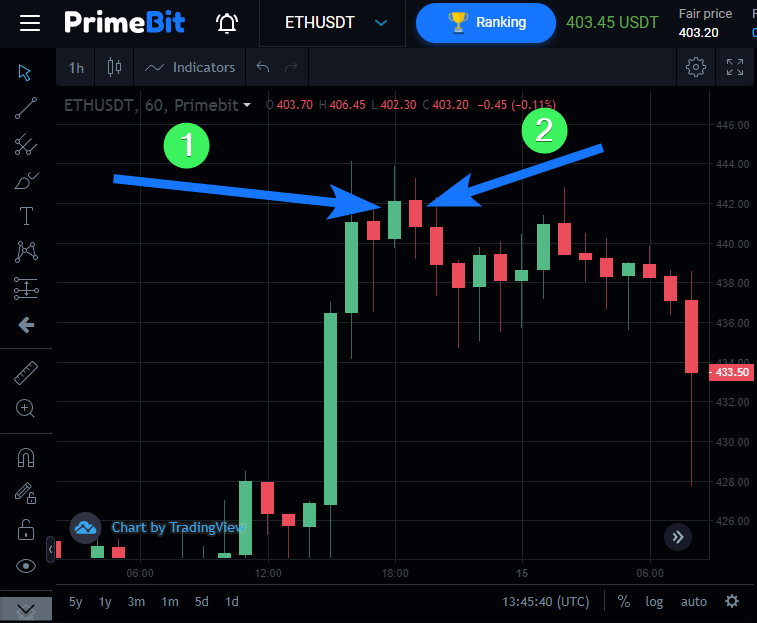
A shooting star
If you see a shooting star at the end of an uptrend you can consider selling. A shooting star is a red candle with a short body and lower shadow, but a very long upper shadow.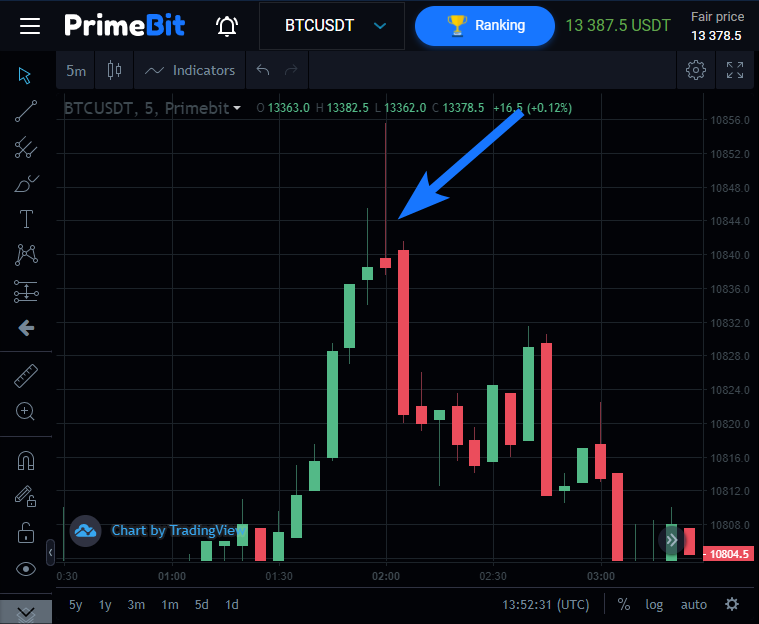
Reading the candlestick patterns is easy to start with, but difficult to master. If you are looking for an opportunity to learn how to do it, take part in the PrimeBit $5,000 Demo Contest, and win prizes without putting your money at risk.
Go to PrimeBit Webtrader, turn your Contest Account on, practice identifying candlestick patterns. Give yourself a chance to win $1,000 and a side prize every week.
